
WWF
Designing the WWF Tesco Global Grower Website for Improved Farm Efficiency and Income Generation
PRODUCT NAME
The WWF Tesco Global Grower website is a platform that aims to help farmers track their losses, identify areas of improvement, and ultimately generate more income from their farms. The website features surveys that collect data from farmers, which is then shared with aggregators for analysis and insights
MY ROLE & RESPONSIBILITIES
As a solo UX designer, I conducted Market Research weekly meetings and designed Solution Evaluations, and created User Journey Mapping, user flow maps, wireframes, and prototypes.
OVERVIEW
The agricultural industry faces numerous challenges, including managing losses, improving efficiency, and maximizing income generation. Farmers often lack the tools and resources to monitor their operations and effectively identify improvement areas. To address this problem, the WWF Tesco Global Grower website was developed to help farmers track their losses and gain insights into their farming practices.
The website’s concept centers around user-friendly surveys that farmers can easily take, with results shared with aggregators for analysis. The platform aims to provide valuable insights into farming operations, enabling farmers to make informed decisions to enhance productivity and income. However, the design process faced several challenges, such as structuring survey questions and accommodating organizations with multiple farms in different locations.
This case study explores the design process of the WWF Tesco Global Grower website, detailing how I addressed the challenges, developed the concept, and delivered a solution that successfully meets the needs of both farmers and organizations with multiple farms worldwide.
CURRENT PROBLEMS
- Farmers struggle to effectively monitor their operations and identify areas of improvement due to the lack of tools and resources.
- Managing losses and maximizing income generation in agricultural operations is a constant challenge for farmers.
- Organizations with multiple farms in different locations face difficulties managing their operations and tracking performance.
OBJECTIVES
- Develop a user-friendly platform that enables farmers to easily take surveys and provide accurate information about their farming practices.
- Share survey results with aggregators to analyze and generate valuable insights for farmers.
- Empower farmers and organizations with data-driven insights to improve farm efficiency, reduce losses, and enhance income generation.
CHALLENGE
- Designing clear and coherent survey questions that effectively capture the required information while remaining user-friendly and understandable was a significant challenge. This included ensuring that some questions added up to 100% and providing clear instructions for users.
- Creating a system that can accommodate organizations with multiple farms in different locations worldwide requires careful consideration. The design had to enable users to manage multiple farms under one account, provide location-specific surveys, and offer aggregated insights for better decision-making.
- Striking the right balance between a seamless user experience and collecting accurate, detailed user data was challenging. The design had to minimize user input errors and ensure that users could easily understand and answer survey questions without feeling overwhelmed or confused.
THE DESIGN PROCESS
I conducted thorough market research and weekly meetings with the target users – farmers and organizations with multiple farms – to understand their needs, preferences, and challenges. This helped in creating user personas and guided the design process.
Market research
I conducted comprehensive market research to understand target users’ preferences and behavior. This included examining demographics, studying user behavior trends, and identifying future market potential. The findings helped shape my design process, ensuring the WWF Tesco Global Grower website met user needs and expectations.
Demographics
- Easy-to-use tools and interfaces that simplify complex tasks.
- Accurate and actionable insights that lead to improved farm efficiency and income generation.
- Access to resources and support to help users make informed decisions.
- Solutions that consider environmental sustainability and responsible farming practices.
- Mobile-friendly and responsive design for seamless access across various devices.
Preferences
- Easy-to-use tools and interfaces that simplify complex tasks.
- Accurate and actionable insights that lead to improved farm efficiency and income generation.
- Access to resources and support to help users make informed decisions.
- Solutions that consider environmental sustainability and responsible farming practices.
- Mobile-friendly and responsive design for seamless access across various devices.
Future Potential
- Farmers and farm managers often multitask, requiring tools that are easy to use and navigate.
- Users are interested in accessing the information on the go, highlighting the importance of mobile-friendly design.
- Farmers are increasingly adopting technology in their day-to-day operations, including farm management software, IoT devices, and precision agriculture solutions.
- Users prioritize tools and resources that provide a clear return on investment (ROI) and tangible benefits to their farming operations.
- The farming community values networking and sharing knowledge, often participating in online forums and social media groups to exchange ideas and experiences.
Future Potential
- Increasing adoption of technology and digital solutions in the agricultural industry.
- Growing awareness and demand for sustainable and environmentally friendly farming practices.
- Government regulations and policies promoting responsible and efficient agricultural practices.
- Expanding global population and the need to optimize food production to meet demand.
- The ongoing shift towards data-driven decision-making in agriculture will drive the need for platforms that provide valuable insights and analytics.
WEEKLY MEETINGS
I scheduled weekly meetings to review progress, discuss challenges, and plan the next steps. These meetings ensured that I stayed on track and maintained a structured approach to the design process. The weekly meetings covered:
Week 1: Project Kickoff and Research
- Introductions and team formation
- Discuss project objectives and scope
- Set deadlines for research completion
Week 2: Research Findings and Information Architecture
- Share research findings on demographics, preferences, and user behavior
- Discuss future potential and market trends
- Develop user persona
- Brainstorm and define the website’s information architecture
- Wireframing
Week 3: Wireframes and Prototyping
- Review initial wireframes
- Adjustments to the information architecture
- Develop high-fidelity prototypes based on refined wireframes
EVALUATING AND SELECTING A PROMISING SOLUTION
Based on the market research, I evaluated different design solutions and selected the one that best aligned with user needs and project objectives. This involved considering user-friendly interfaces, responsive design, and a scalable system accommodating organizations with multiple farms.
- Dashboard: The Dashboard serves as the central hub for users, providing an overview of their key activities, progress, and insights. It summarizes recent survey submissions, updates from the selected organization, and quick access to the most commonly used tools.
- WWF – Select Organization: Allows users to search for and choose their affiliated organization, such as WWF or Tesco Global Grower, to receive tailored content and guidance.
- Search: A search functionality to help users find the relevant organization.
- Report In-field: Enables users to report in-field data, such as crop losses or pest sightings, directly to their selected organization for analysis and recommendations.
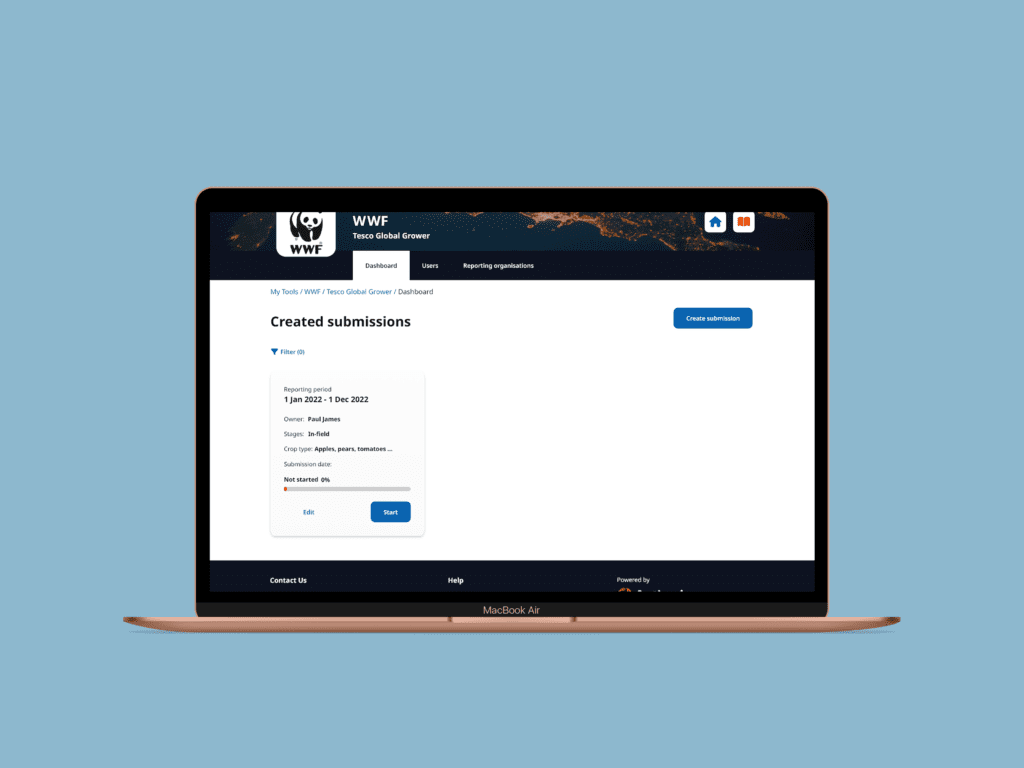
- Submission – Create Submission: This screen allows users to create a new survey submission, inputting their responses to questions about their farming practices, crop data, and sustainability measures. Users can save their progress and return to complete the survey later.
Sharing Results: Upon completing a survey, users can share their results with their selected organization or other stakeholders. This feature facilitates collaboration and communication between farmers and organizations, enabling them to work together to improve farming practices.
Overview: The Overview screen summarizes the user’s survey responses, offering insights and comparisons with similar farms. This information helps users identify areas for improvement and potential opportunities to optimize their operations.
Survey: The Survey screen is where users answer questions about their farming practices, pest management, sustainability efforts, and other relevant topics. The survey is designed to be user-friendly, intuitive, and engaging, with clear instructions and helpful tooltips.
- Users: The Users screen allows farm owners or managers to invite and manage additional users who can access and contribute to the account. This feature enables collaboration between team members and streamlines farm management tasks.
- Reporting Organizations: This screen displays a list of organizations users can report their survey data, such as WWF, Tesco Global Grower, or other relevant entities. Users can choose which organizations to share their data with and view any specific reporting requirements or guidelines the selected organization provides.
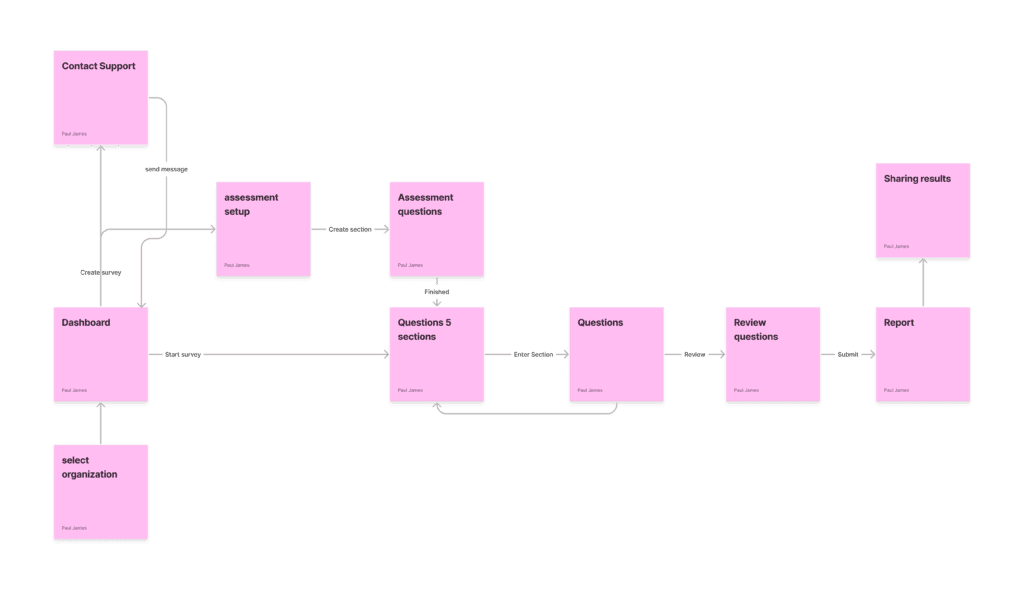
USER FLOW
I designed a user flow that outlined the steps users would take while navigating the website, from landing on the homepage to completing a survey and receiving insights. This ensured a logical, intuitive, and seamless user experience, guiding them through the process effortlessly.
WIREFRAMING
I developed low-fidelity wireframes to visualize the website’s layout, focusing on the survey pages and key user interactions. These wireframes served as a blueprint for the design, helping me refine the information architecture and layout before moving on to the design stage.
Upload Image...
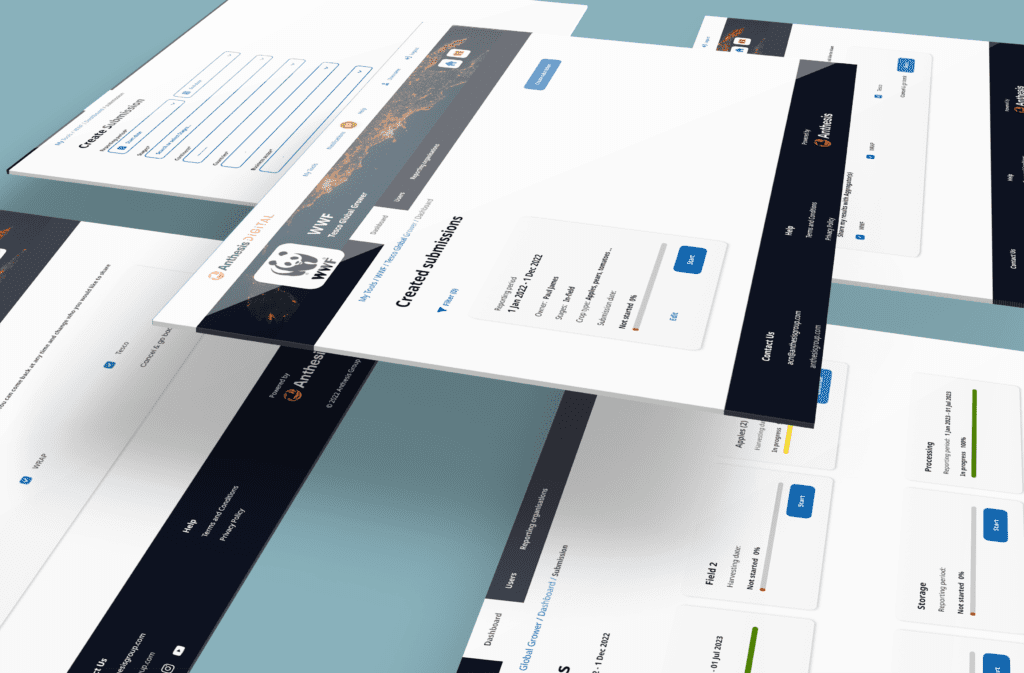
Designs
I created high-fidelity designs based on refined wireframes, incorporating visual design elements, components, and a responsive layout. I then prototyped the designs and used these prototypes for usability testing to gather user feedback and identify areas for improvement.


PROJECT OUTCOME
The outcome of my design process was a user-friendly, responsive, and scalable WWF product that met the project objectives. I successfully addressed user needs, providing farmers and organizations an easy-to-use platform for taking surveys, tracking losses, and gaining valuable insights to improve their farming practices and income generation.
My iterative design process and incorporation of market research led to a solution that provided a seamless user experience and valuable tool for the target audience.
Farmers and organizations with multiple farms can now easily take surveys, track their losses, and gain valuable insights to improve their farming practices and income generation.